Why is reporting so important?
Reporting is important, no one would argue that. Even our private life depends on different statistics, now more than ever (we all know why), not to mention the business sphere. It’s well-known that the numbers speak: if you can measure something, you’ll always be able to analyze and improve the situation and reach your goals. That’s why the analytical data gives us this great feeling of control and safety.
The report is the most important fact for decision making in a business. So, dealing with reporting is an essential part of every Manager’s day to day, playing an especially important role for Marketing Managers. A lot of analytics software has been created over the years to help us, Marketers, set up, update, and visualize our data and HubSpot is no exception.
In this article, we will give you an overview of the HubSpot Reporting tool and its latest updates and new functionalities to help you set up your analytics in HubSpot.
HubSpot Reporting: what to start with
With HubSpot, you can run a lot of marketing activities and get a lot of data pulled into your account, starting from contacts with their info like names, postal code, email address, etc. and the ways they interact with your website, blog, and emails (visits, clicks, downloads, email opens, etc.) to the key information about the cost of your Ad campaigns and the ROI…

So, what to start with?
First of all,define the KPIs of your companyto be sure about what exactly you have to measure. Make sure all the stakeholders are aligned with that and that your Marketing team understands what data you have to present at the end of the month, the quarter, or the year. Be sure that if the data enters HubSpot, you will be able to report on it, so check that your integrations are up and running.
The next important step is to check how and which information you gather in your account, and in which format. Make sure that yourpaid accounts and social mediaare integrated with HubSpot, and that the tracking code is in place. When it comes to new contacts creation, avoid duplicated info and unformatted data.
Also, verify that all the information is stored in the corresponding properties (the classic one is mixing up First Name and Last Name) and if there are some custom properties missing for storing important data, then create them.
5 ways to create a report in HubSpot
So, your data is updated and perfectly formatted, you have a list of KPIs, you have launched your marketing campaigns and now you are eager to see the results. There are several ways to set up Reporting in HubSpot. Let’s check them out one by one:
- Saving from different Hubs. Each Hub in HubSpot and almost every part of it has its own analytics tools that help you see the results of your actions without even changing the tab. For example, in the Ads tab, you can click on Analyze and directly see how your Paid campaigns are performing. Here you will be able to see the number of impressions, clicks, contacts, deals, the total amount spent, and the ROI and dive deeper into your campaigns’ statistics (e.g., campaigns with high and low cost per click, per contact, etc.)
- Analytics tools. The analytics tools help you get an overview of the following (the options depend on the license you have):
- Traffic and Website Analytics – helps you see what exactly is driving traffic to your website.
- Campaign Analytics – measures your campaign performance over time.
- Contact Analytics – shows more info about the contacts in your database, breaking them down by source, region, activities, or lifecycle stage.
- Events Analytics – this tool tracks a certain action and HubSpot counts when such an event is completed, for example, form submissions, URL visits, or even custom events like log-ins.
- Sales content Analytics – allows you to analyze the effectiveness of your sales templates, documents, and sequences.
- Sales and Service team productivity – shows your sales and service teams’ performance across tickets.
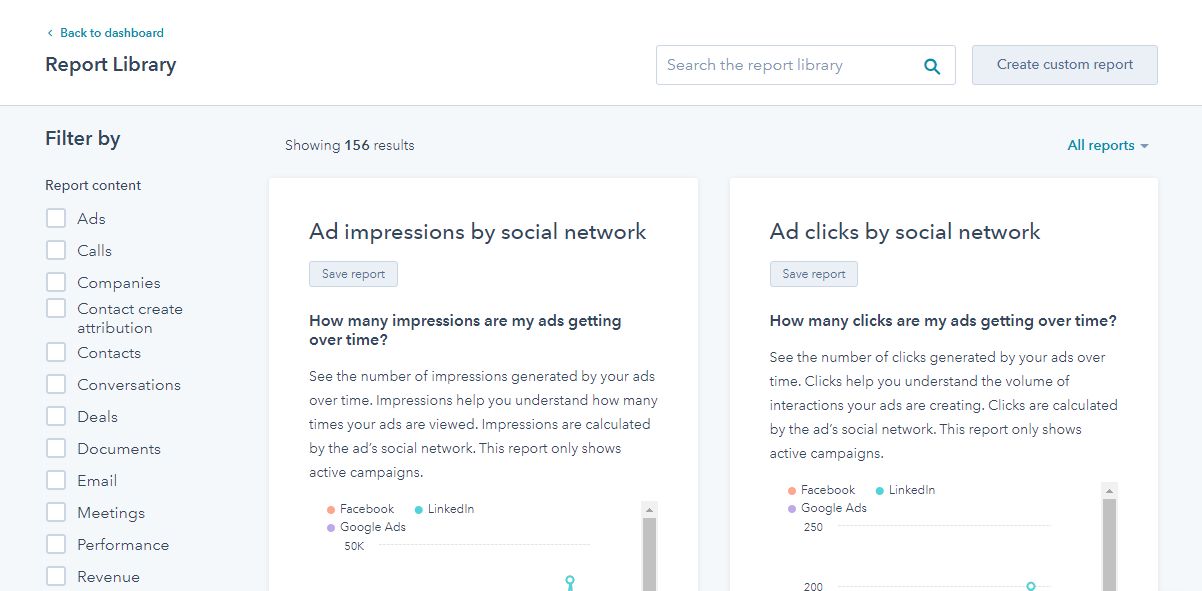
- Using HubSpot library.From your Reports Tool, you can access the HubSpot Report library. There you can find a set of pre-set reports that you can directly save or customize and filter before saving. The panel on the left will help you find the report you need by filtering by Content (for example, Contacts, Attribution, Email, and many more) or by Report types (Comparisons, Funnels, Overviews, etc.)

- Building a custom report from scratch.Didn’t find the report you were looking for? Try building it yourself! There are several types of reports that you can create:
- Single object and Cross-object reports - you can either report on one object type (like Deals) or analyze the connection between two different object types (like Contacts and Companies).
- Funnel reports show the conversion rates between lifecycle, deal pipeline, or custom event funnel stages. You can see the number of contacts or deals that have gone through all the stages or the ones that have gone through any stages, to get a more general report on the different stages.
- Attribution reports. You can create two types of reports: a revenue report that shows which assets, sources, and actions had an impact on your revenue and a contact create report that shows your marketing actions’ impact on generating leads.
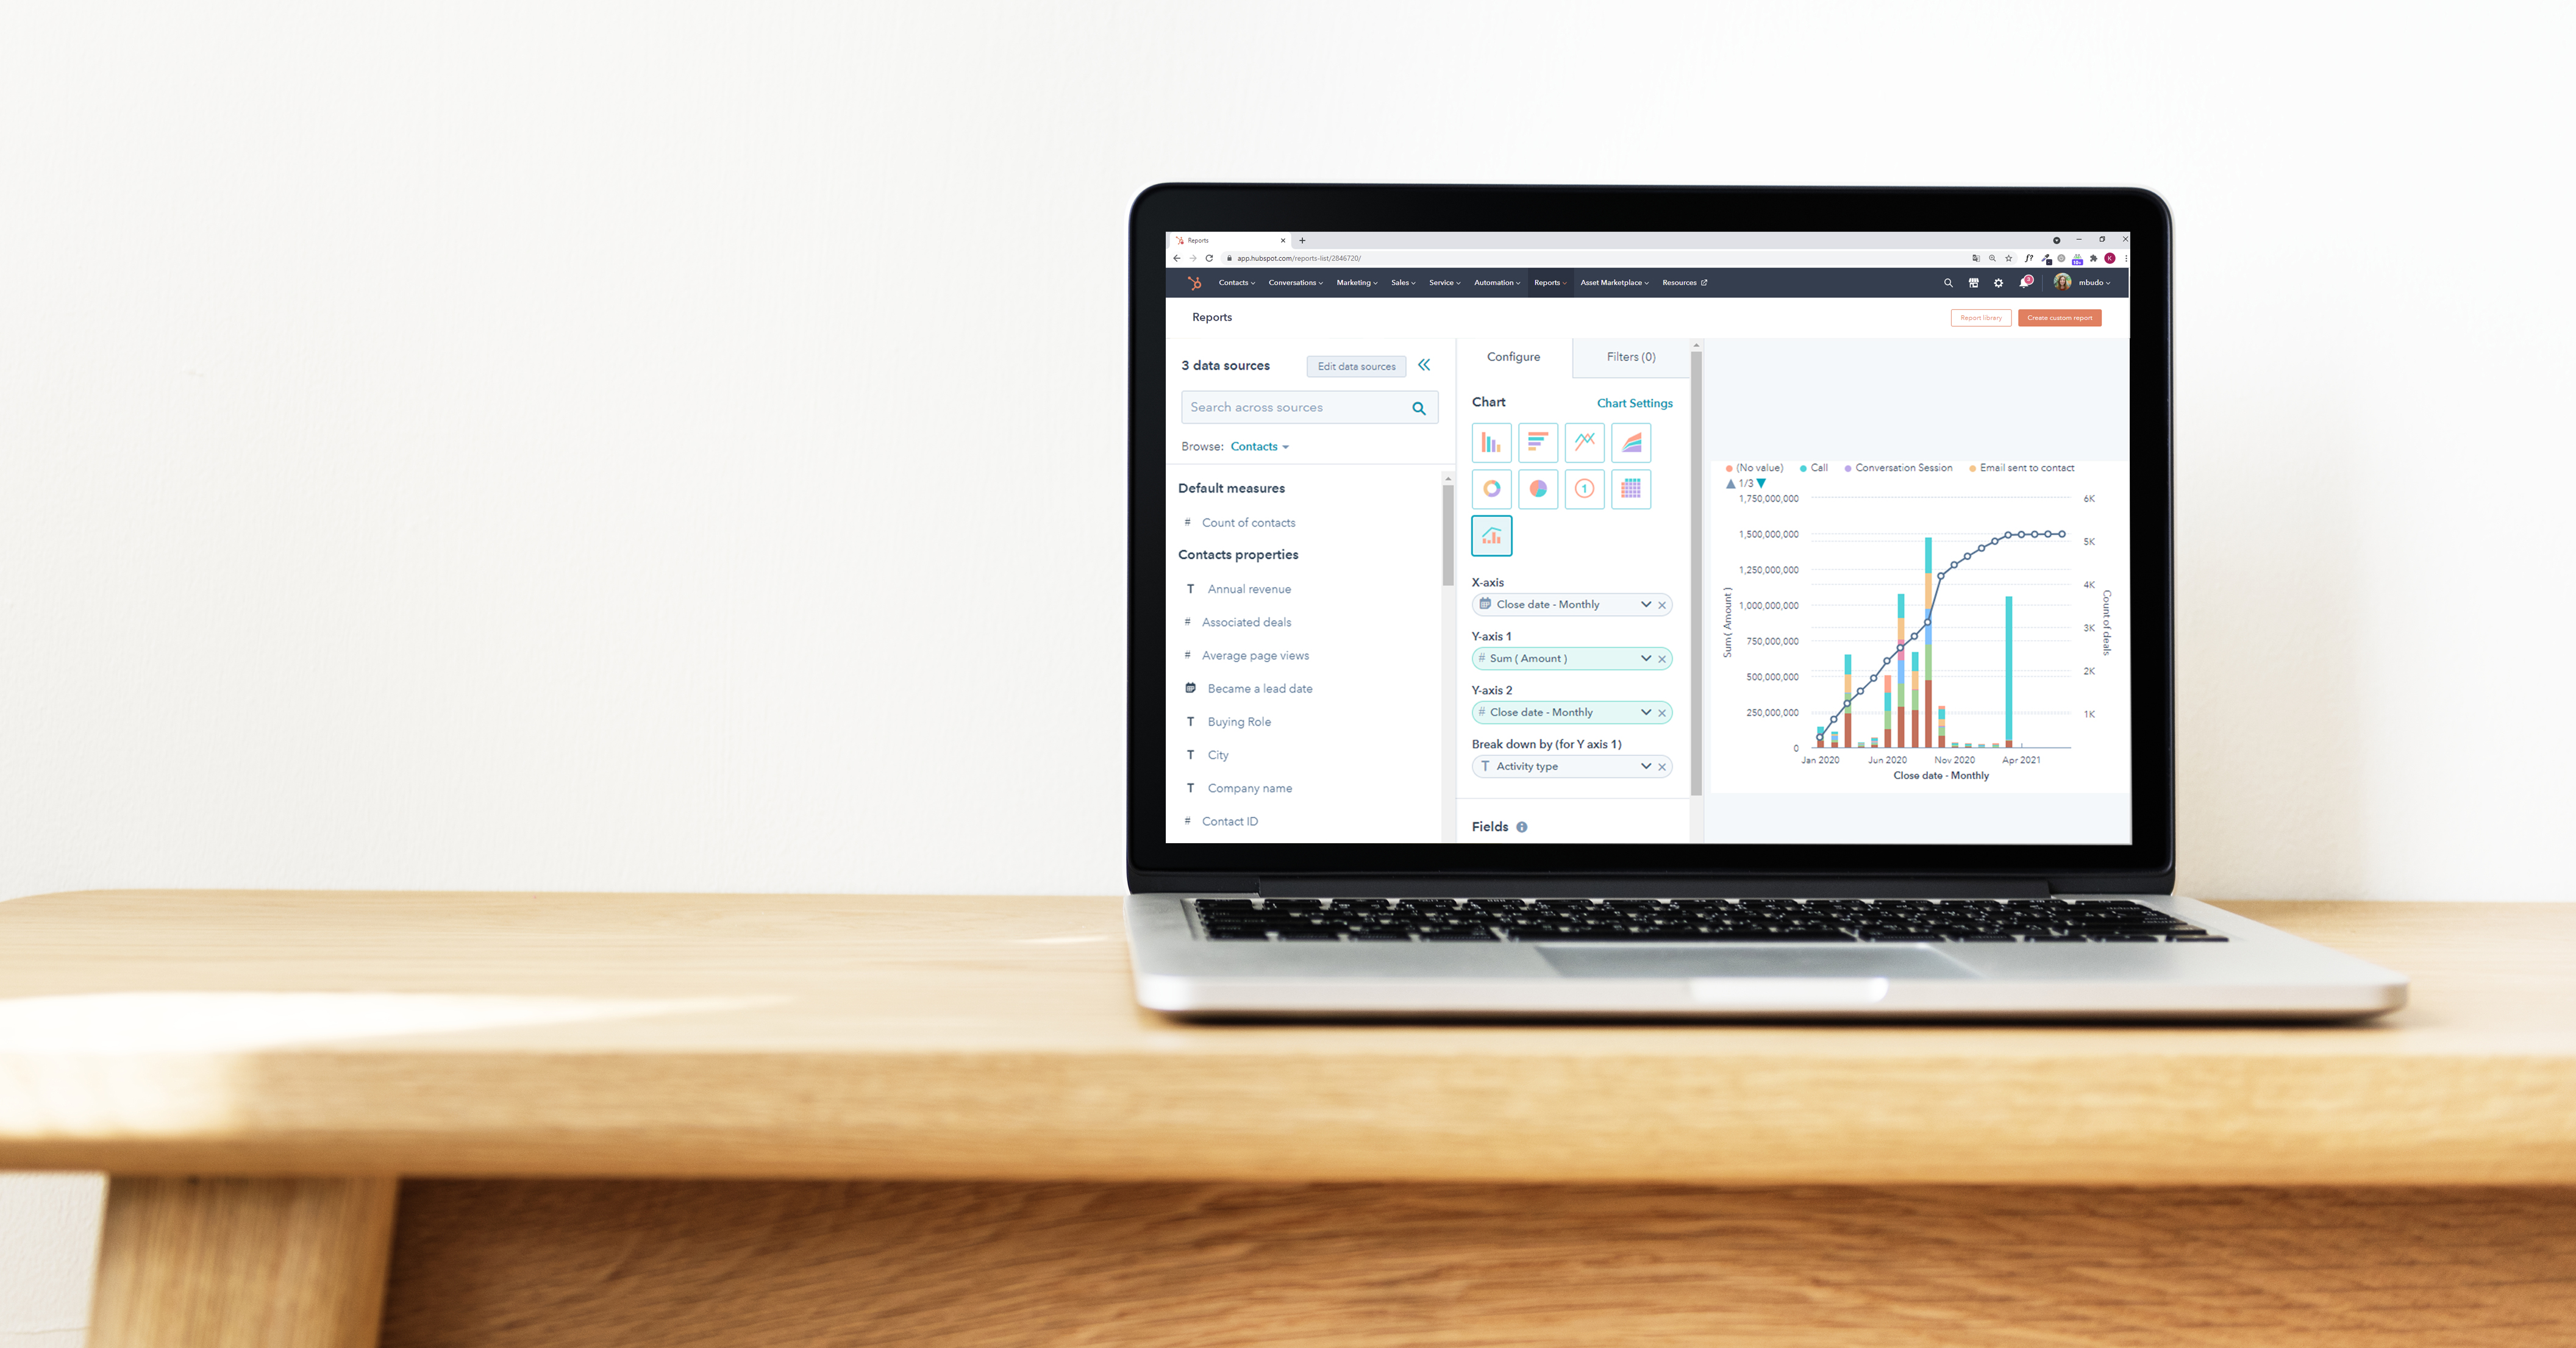
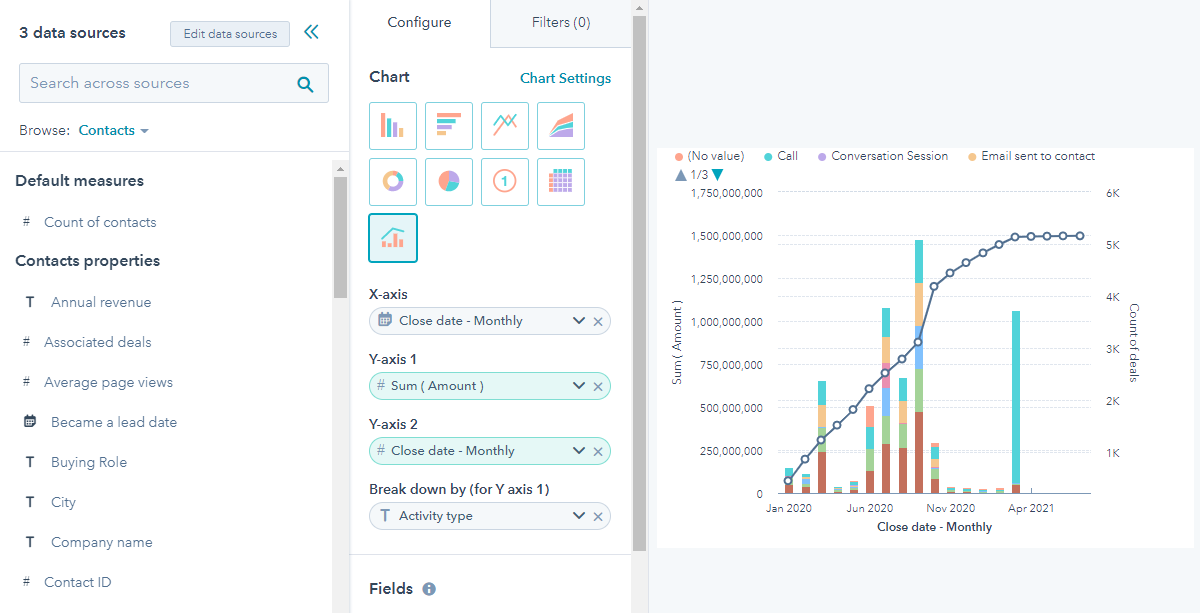
- Custom report builder. In October 2020, HubSpot launched an advanced builder allowing you to report on data from sales and marketing activities in addition to objects. You can select primary and secondary data sources (up to five), select the chart type, add different fields and filters to the report and choose in which way your data will be visualized (dimensions and measures).

HubSpot dashboards and what can be done with them
Another great functionality of the HubSpot Reporting Tool is grouping reports into dashboards. There are some pre-set dashboards in the Dashboard library that you can save in just one click. Also, there is a possibility to create a blank dashboard. Here is a list of actions that can be applied to dashboards in order to set it up your way:
- Cloning reportswill make your life easier when creating a new report that is similar to an already existing one. Just clone and modify it instead of creating a new one from scratch.
- Filtering reports:you can filter reports on your dashboard or customize your dashboard. When filtering a report, you will be given options depending on the report type, like filtering by date range (the most common filter) or by device type for traffic reports. You can also filter your whole dashboa
 rd directly by date range, owners, teams, deal pipeline, or ticket pipeline.
 - Moving or copying todo different dashboards is especially useful when you have different teams working with HubSpot, let’s say Sales and Marketing teams. Your teams will probably need to see the same report, but filter or break it down by different parameters, so copying a report to both Marketing a
- Sales dashboards and adapting itfor each team instead of modifying one report, again and again, is definitely a good idea.
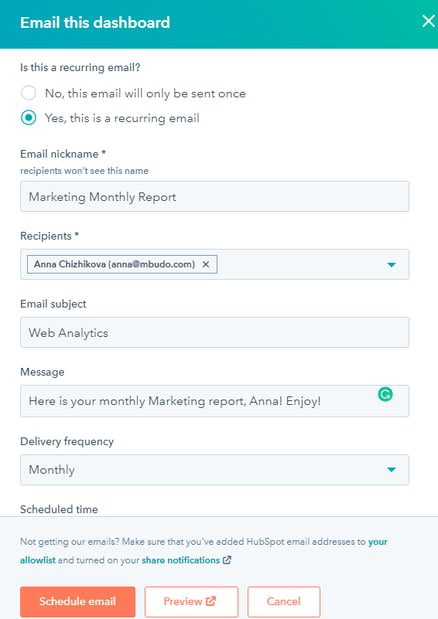
- Exporting reports: HubSpot allows you to export both your data and your visual reports and dashboards in different formats (CSV, XLSX or PDF, PPTX, and ZIP of PNGs for visual data and dashboards). You can also choose a delivery frequency, so HubSpot will email your updated dashboard automatically to all the important stakeholders at the date and time and with the periodicity you choose.
- Change visibility settings & access & owner:with HubSpot reporting tools you can create reports visible only for you, your team, or for everyone. You also can choose whether everyone can edit the report.
Data visualization best practices
There are several ways to visualize your data with HubSpot. Here is a list of the report types and some advice on when it’s most appropriate to use what type:
- Bar and column charts –you can use them for showing how several different metrics compare to each other, for example, a number of deals created from different sources.
- Line graphs – represent the evolution of your data over time, for example, your website session totals by day.
- Area charts – are used for comparing different metrics over time, e.g. your website session totals by day broken down by source (to compare what source evolves better over time).
- Pie and donut charts –are perfect for showing static statistic numbers as parts of a whole, for example, new contacts created in total, by source.
- Tables – tables are great for showing a lot of data in one place. However, they work rather like a static photo, so if you want to analyze the numbers in a concrete moment, use a table. For showing the evolution of data, it’s recommended to choose a more visual way of representing it.
As a Marketing Manager you know that it’s very important to not only set up your reports but also to read them correctly. When analyzing a report, try to check the following for a better understanding of your data:
- The smallest and the largest values
- The mean, median, and mode
- Any anomalies in the performance (for example a peak in your New Contacts by day report for a concrete date. Try to understand what actions brought so many new leads?)
- Analyze the overall trend and compare it to the previous date range.
- Compare your data to the
- Try to find out a pattern. How can you explain what the report shows you?
As you can see, every Marketing Manager should have a to-go place showing the whole picture of Marketing campaigns, actions, and results. HubSpot Reporting Tools can help you and your team always stay up to date and develop your Marketing Strategy and make the right decisions by analyzing the data.
Since HubSpot is always growing and adding new features according to the users’ needs, there are many surprises on the way when it comes to analytics, for example, Conversation Intelligence Reporting. If you're interested in discovering this and much more, you can always count on mbudo.

Anna Chizhikova
Anna holds a degree in Linguistics, and has found her vocation in the field of Inbound Marketing and Marketing Automation. She loves combining her technical and creative knowledge with her passion for languages in the day-to-day tasks. She also loves painting, reading and doing yoga in her free time.
It may interest you
LATEST
BLOG POSTS
SUBSCRIBE TO MBUDO BLOG
And get your inbound news directly in
your inbox, once a month.

